
The 5StarsStocks Calculator is a free, easy-to-use tool that helps traders and investors make smarter decisions. It does all the hard math for you — profit, loss, risk, position size, and more — in just a few seconds. You do not need any finance background or technical knowledge to use it. Just enter your numbers and get clear results instantly.
This guide explains every feature of the tool, what each one means, and how to use it step by step.
Getting Started — The Toolbar
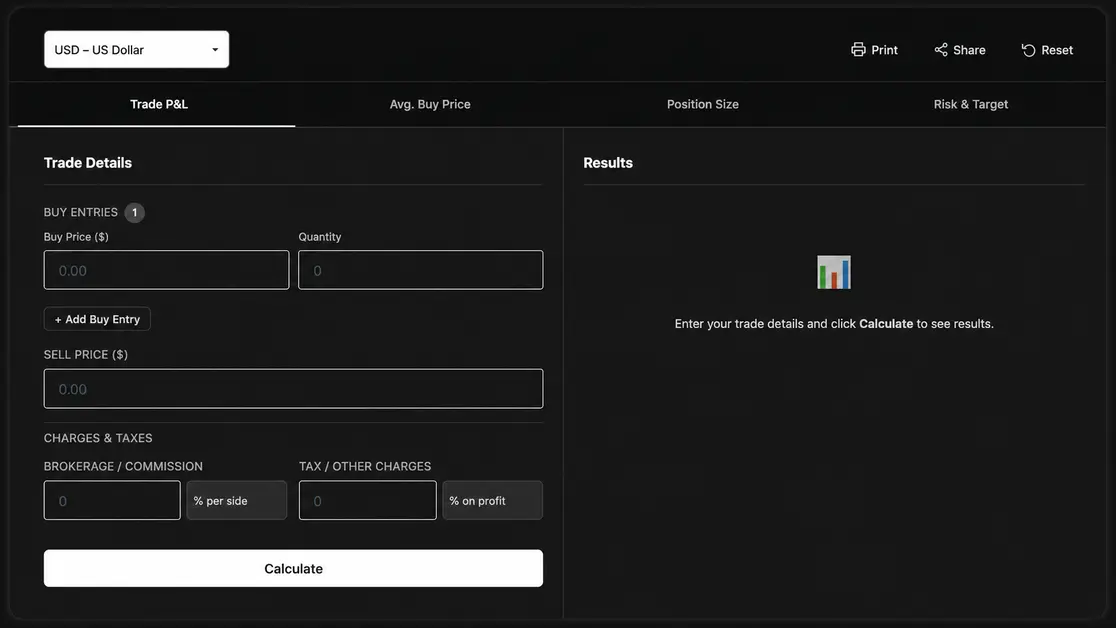
When you open the calculator, you will see a clean toolbar at the very top. It has three important controls.
Currency Selector
The first thing you should do is select your currency. Click the dropdown on the left side of the toolbar. You will find 30 currencies available, including:
- USD – US Dollar
- EUR – Euro
- GBP – British Pound
- INR – Indian Rupee
- PKR – Pakistani Rupee
- CAD – Canadian Dollar
- AUD – Australian Dollar
- JPY – Japanese Yen
- AED – UAE Dirham
- SAR – Saudi Riyal
- And many more
Once you select a currency, the symbol updates automatically across all sections and all results. You only need to set it once.
Print Button
Click the Print button to print your results. The calculator has a clean print layout built in. All input forms are hidden during printing, and only your results are shown on paper. This is useful when you want to keep a physical record of a trade.
Share Button
Click the Share button after you calculate a result. It copies a special link to your clipboard. You can paste that link and send it to anyone. When they open the link, they will see the exact same results you calculated. This is great for sharing trade ideas with friends or partners.
Reset Button
The Reset button clears everything — all inputs, all results, and all extra entries you added. Use it when you want to start a fresh calculation from scratch.
The Four Main Tabs
The calculator is organized into four tabs. Each tab is a separate tool with its own purpose. You can switch between them freely without losing anything in the other tabs.
Tab 1 — Trade P&L (Profit and Loss)
This is the main tab and the most used feature of the calculator. It tells you exactly how much money you made or lost on a trade, including all fees and taxes.
What It Does
When you buy shares at one price and sell them at another, the difference is your profit or loss. But the real picture includes brokerage charges and taxes too. This tab calculates all of that together and shows you your true result.
How to Use It
Step 1 — Enter Your Buy Details
You will see a Buy Price field and a Quantity field side by side. Enter the price you paid per share in the Buy Price field. Enter how many shares you bought in the Quantity field.
If you bought the same stock at different times and at different prices, click the + Add Buy Entry button. A new row will appear. You can add as many buy entries as you need. The calculator will combine them all automatically and work out your weighted average buy price.
To remove an extra entry you no longer need, click the small ✕ button next to that row.
Step 2 — Enter Your Sell Price
In the Sell Price field, enter the price at which you sold or plan to sell the shares.
Step 3 — Add Brokerage and Commission (Optional)
Under the Charges and Taxes section, you will find the Brokerage field. Enter your broker’s fee here. You can choose how the fee is applied:
- Flat amount — a fixed fee charged per trade, like $5 or ₹20
- % per side — a percentage charged on both the buy and the sell, like 0.1%
If you are not sure, check your broker’s fee structure. If your broker charges nothing, leave this field at 0.
Step 4 — Add Tax (Optional)
Enter any tax or other charges in the Tax field. You can apply it as:
- Flat amount — a fixed tax amount
- % on profit — a percentage taken from your gross profit only
If you do not pay tax on trades or are not sure, you can leave this at 0.
Step 5 — Click Calculate
Click the white Calculate button. Your results appear instantly on the right side.
What the Results Mean
- Net P&L — Your actual profit or loss after all charges and taxes are deducted. This is the number that matters most.
- Gross Profit or Loss — Your profit or loss before any fees or taxes are taken out.
- Total Investment — The total money you put in, including the buy-side brokerage fee.
- Final Sale Amount — The total money you received from selling all your shares.
- Return on Investment (ROI) — How much percentage return you earned on the money you actually invested.
- Net P&L % — Your net profit or loss shown as a percentage of your original buy cost.
- Break-Even Price — The sell price you need to cover all your costs and walk away with zero profit or loss. This is always slightly above your buy price because of charges.
- Average Buy Price — If you made multiple buy entries, this shows your weighted average cost per share.
- Total Quantity — The total number of shares across all your buy entries.
- Brokerage (Buy side) — The fee charged on your purchase.
- Brokerage (Sell side) — The fee charged on your sale.
- Tax / Other Charges — The tax amount calculated based on your inputs.
- Total Charges — All fees and taxes combined into one number.
A green badge saying Profit Trade appears when your net result is positive. A red badge saying Loss Trade appears when it is negative. A neutral badge appears if you exactly broke even.
Tab 2 — Average Buy Price
This tab is for traders and investors who buy shares of the same stock at different times and at different prices. It tells you the true average price you paid per share across all your purchases.
What It Does
When you buy 100 shares at $10 and later buy another 100 shares at $12, your average cost is not simply $11. It depends on how many shares you bought at each price. This tab calculates that weighted average correctly.
How to Use It
Step 1 — Enter Your First Purchase
Enter the price you paid per share and the quantity you bought in the first row.
Step 2 — Add More Entries
Click + Add Entry to add another purchase. Enter the price and quantity for that purchase. Keep adding entries for every time you bought shares of the same stock. There is no limit on the number of entries.
If you want to remove an entry, click the ✕ button next to it.
Step 3 — Click Calculate Average
Click the Calculate Average button. Your results appear instantly.
What the Results Mean
- Weighted Average Buy Price — Your true average cost per share. This is the price the stock needs to be above for your total position to be in profit.
- Total Quantity — The total number of shares you hold across all purchases.
- Total Amount Invested — The total money spent buying all your shares.
- Entry Breakdown — A clear list showing each individual purchase with its cost, so you can see how each entry contributed to the total.
Tab 3 — Position Size Calculator
This tab answers one of the most important questions in trading: how many shares should I buy? Most traders skip this step and buy based on feeling. That leads to oversized positions that cause big losses when a trade goes wrong.
What It Does
The position size calculator uses your account size and your personal risk limit to tell you exactly how many shares to buy on a trade. It makes sure that if the stock hits your stop loss, you only lose the amount you planned — not more.
How to Use It
Step 1 — Enter Your Total Trading Capital
This is the total amount of money you have in your trading account. For example, $10,000 or ₨500,000.
Step 2 — Enter Your Risk Per Trade (%)
This is the percentage of your total capital you are willing to lose on this one trade if it goes wrong. Most traders use 1% to 3%. For example, if your capital is $10,000 and you enter 2%, you are willing to risk $200 on this trade.
Step 3 — Enter the Entry Price
The price at which you plan to buy the stock.
Step 4 — Enter the Stop Loss Price
The price at which you will exit the trade to cut your loss. This must be below your entry price for a standard long trade. For example, if you buy at $50, your stop loss might be at $47.
Step 5 — Click Calculate Position
Click the Calculate Position button to see your results.
What the Results Mean
- Recommended Shares — The exact number of shares you should buy. Buying this amount means your maximum loss equals your planned risk amount if the stop loss is hit.
- Risk Amount — The dollar amount you are risking on this trade. This comes from your capital multiplied by your risk percentage.
- Total Position Value — The total cost of buying the recommended number of shares at the entry price.
- % of Capital Used — What percentage of your total account this position uses up.
- Risk per Share — The difference between your entry price and stop loss price. This is how much you lose on each share if stopped out.
- Stop Loss Distance — How far away the stop loss is from your entry price, shown as a percentage.
Tab 4 — Risk and Target Calculator
This tab helps you measure how good a trade setup is before you enter it. It compares how much you could lose against how much you could gain. A trade where you risk $1 to make $3 is a much better setup than one where you risk $1 to make $0.80.
What It Does
It calculates the Risk to Reward Ratio of your trade and tells you whether the setup is worth taking.
How to Use It
Step 1 — Enter the Entry Price
The price at which you plan to buy the stock.
Step 2 — Enter the Stop Loss Price
The price where you will exit if the trade goes against you. This should be below your entry price.
Step 3 — Enter the Target Price
The price where you plan to take profit. This should be above your entry price.
Step 4 — Enter the Quantity
The number of shares you plan to trade.
Step 5 — Enter a Desired R:R Ratio (Optional)
This is an optional field. If you want to target a specific risk-to-reward ratio, enter that number here. For example, enter 2 if you want a 1:2 ratio. The calculator will automatically show you what your target price should be to achieve that ratio, based on your entry and stop loss prices.
Step 6 — Click Calculate R:R
Click the Calculate R:R button to see all your results.
What the Results Mean
- Risk to Reward Ratio — Shown as 1:X. A ratio of 1:2 means for every $1 you risk, you stand to make $2. Most experienced traders look for at least 1:2 before entering a trade.
- Max Risk Amount — The total dollar amount you could lose if the price hits your stop loss.
- Potential Reward — The total dollar amount you could gain if the price hits your target.
- Stop Loss Distance — How many dollars below your entry price the stop loss is placed.
- Stop Loss % — The stop loss distance shown as a percentage of your entry price.
- Target Distance — How many dollars above your entry price your target is placed.
- Target % — The target distance shown as a percentage of your entry price.
- Break-Even Win Rate — The minimum percentage of trades you need to win at this R:R ratio just to break even over time. For example, at 1:2, you only need to win 33% of trades to stay profitable.
- Auto Target Price — If you entered a desired R:R ratio, this shows the exact price your target needs to be at to achieve that ratio.
The calculator also shows a colored badge rating your setup:
- Green — Good Setup means your R:R ratio is 2 or better. This is a strong setup.
- Yellow — Acceptable Setup means your ratio is between 1 and 2. The trade is okay but not ideal.
- Red — Poor Setup means your ratio is below 1. You are risking more than you could gain. Most experienced traders avoid these setups.
Tips for Getting the Most from the Calculator
Always select your currency first. It takes one second and makes all your numbers display correctly from the start.
Use multiple buy entries when you have an average position. Many traders buy in stages. The average buy price feature gives you your true cost basis so you know exactly where you stand.
Do not skip the charges fields. Even small brokerage fees add up. A 0.1% fee on each side of a trade means 0.2% off every round trip. On large positions or frequent trades, this changes your real results meaningfully.
Check the Risk and Target tab before every trade. If the ratio is below 1:1.5, the trade might not be worth taking regardless of how good it looks on a chart.
Use the Share button to save your work. The link captures your current results. Paste it somewhere safe or send it to your trading partner before the results get cleared.
Use the Print button for your trade journal. Printing results after each trade gives you a clean physical record. Over time, reviewing these prints helps you spot patterns in your own trading behavior.
Press Reset when switching to a new trade. This clears everything cleanly and prevents you from accidentally mixing old numbers with new ones.
Who This Tool Is For
The 5StarsStocks Calculator is built for everyone who trades or invests in stocks.
Beginners can use the Trade P&L tab to simply check if a trade made money and how much. As they grow more confident, they can add fees, use the average buy price section, and eventually learn to size positions correctly using the Position Size tab.
Intermediate traders will get the most value from running all four tabs together. Before entering a trade, they can check the Risk and Target ratio, calculate the correct position size, and then track the final profit or loss result when they exit.
Experienced investors can use the multiple buy entry feature to manage averaged-down positions, track weighted cost basis across large portfolios, and quickly test different exit scenarios to decide whether to hold or sell.
The tool works on every device — phone, tablet, laptop, and desktop. The layout adjusts automatically so everything stays readable no matter what screen you are using.
A Quick Example — How a Full Calculation Looks
You want to buy shares of a stock. Here is how you would use the tool from start to finish.
Setting up the trade:
- You open the calculator and select USD as your currency.
- You click the Risk and Target tab and enter Entry Price $50, Stop Loss $47, Target $56, and Quantity 100.
- The result shows a Risk to Reward of 1:2 — a good setup. Your max risk is $300 and your potential reward is $600.
- You switch to the Position Size tab. Your account has $20,000 and you risk 1.5% per trade.
- You enter Entry $50 and Stop Loss $47. The result says buy 100 shares — matching what you planned.
After the trade closes:
- You switch to the Trade P&L tab. You enter Buy Price $50, Quantity 100, and Sell Price $56.
- You add a 0.1% brokerage fee (% per side) and no tax.
- You click Calculate. The result shows Net P&L of $589.50 after fees, a 5.9% return, and a break-even price of $50.10.
- You click Share to save the link and then Print to add it to your trade journal.
That is the complete process from planning to recording — done in under two minutes.